A year or so ago I optimized a library I wrote - I made it faster but couldn't make a dent in memory-efficiency. A week or so back I got some free time on my hands and decided to try squeezing some more blood out of that stone while also working on another library I wrote.
Prologue
I didn't give much thought to the computer I used for benchmarking the first time around - it was my daily-driver laptop with an i7-7660 and 32 gigs of DDR4-3200 - but lately I've gotten a bug up my butt about how modern software engineers don't care about their software's performance because they write/test their code on cutting-edge machines that drown their incompetency under an ocean of transistors. [1]
Therefore, this time around I decided to run all my tests on the oldest hardware I had laying around: my trusty Lenovo X201 with a Core i5-560M [2] and 8 gigs of DDR3-1600 RAM - I figured if the code runs fast on this machine it should run fast anywhere. To keep myself honest I decided to benchmark on Python 3.10 instead of 3.11 which has significant performance improvements.
My benchmarking methodology hadn't changed: I reboot before collecting data to mitigate performance impacts from other applications, empty any caches and reset any CPU-internal statistics that may impact timing; I run the benchmark five times, dropping the best/worst runs to mitigate the worst of random variance; I use Scalene while benchmarking to find potential areas for improvement:
for i in {1..5}; do scalene --outfile "run_${i}".json --json --cli --use-virtual-time --profile-all --profile-exclude threading bench.py; done
The benchmarking script is the same as last time:
from pathlib import Path
from time import perf_counter
from zipfile import ZipFile

from py_fast_trie import XFastTrie

def main():
    t = XFastTrie()
    start = perf_counter()

    for i in range(1, 2):
        name = f"primes{i}"
        p = Path(f"~/bench/{name}.zip").expanduser()
        ctr = 0

        with ZipFile(p) as z:
            with z.open(f"{name}.txt") as f:
                print(f"opened {name}.txt")
                for l in f.readlines()[2:]:
                    for n in l.split():
                        t += int(n)
                        ctr += 1

                        if ctr % 100000 == 0:
                            print(f"{ctr}: {perf_counter() - start}")

if __name__ == "__main__": main()
Baseline
Before I got started, I wanted some new baseline numbers to measure my progress:
| Primes Inserted | Run 1 | Run 2 | Run 3 | Run 4 | Run 5 |
|---|---|---|---|---|---|
| 100,000 | 51.398 | 49.750 | 51.120 | 49.866 | 48.949 |
| 200,000 | 103.161 | 100.806 | 103.633 | 101.060 | 99.302 |
| 300,000 | 155.839 | 152.914 | 157.379 | 153.429 | 150.755 |
| 400,000 | 206.385 | 202.690 | 208.936 | 203.560 | 199.885 |
| 500,000 | 258.164 | 253.589 | 261.741 | 255.263 | 250.223 |
| 600,000 | 310.564 | 305.287 | 315.163 | 307.331 | 301.320 |
| 700,000 | 360.837 | 355.014 | 366.638 | 357.365 | 350.446 |
| 800,000 | 409.455 | 403.542 | 416.476 | 405.792 | 398.305 |
| 900,000 | 468.603 | 462.091 | 476.522 | 464.563 | 456.567 |
| 1,000,000 | 518.218 | 510.928 | 526.935 | 513.607 | 505.245 |
I knew running the benchmark on a CPU almost 7 years older than before with an older memory architecture at half the speed would impact the numbers, but after so much work to break the 300 second barrier last time seeing an average runtime of 514.251 seconds with no runs faster than 500 seconds did hurt a bit. I turned that pain into fuel for improving my code and dove in.
__setitem__() Helper Function Inlining
I'd planned to focus solely on py-fast-trie this time around when I had a trademark Intrusive Thought - my X-fast trie implementation queries for values in dicts much more than it inserts them but __setitem()__ is still in my benchmark's critical path, shouldn't I take a look at it since I didn't touch it last time? Sure enough, it wasn't hard to find some dead weight:
def __setitem__(self, key: Hashable, value: Any) -> None:
    [...]

    # The index of the key in _keys and its related value in _values
    _, data_idx = self._lookup(key)

    [...]

    nearest_nbr = self._get_open_neighbor(expected_lookup_idx)
Two function calls in the critical path that could easily be inlined - and as I've said before, calling Python functions is costly. Inlining those functions netted a slight performance increase:
| Primes Inserted | Run 1 | Run 2 | Run 3 | Run 4 | Run 5 |
|---|---|---|---|---|---|
| 100,000 | 50.082 | 49.233 | 48.365 | 50.747 | 49.613 |
| 200,000 | 101.585 | 99.765 | 98.068 | 102.945 | 102.066 |
| 300,000 | 154.028 | 151.189 | 148.803 | 155.969 | 153.971 |
| 400,000 | 204.098 | 200.310 | 197.377 | 206.738 | 203.776 |
| 500,000 | 255.665 | 250.640 | 247.193 | 258.789 | 254.766 |
| 600,000 | 307.780 | 301.796 | 297.742 | 311.408 | 306.524 |
| 700,000 | 357.761 | 351.148 | 346.327 | 362.116 | 356.393 |
| 800,000 | 406.153 | 398.758 | 393.499 | 411.255 | 404.527 |
| 900,000 | 465.131 | 456.253 | 450.472 | 470.748 | 462.860 |
| 1,000,000 | 514.331 | 504.381 | 498.860 | 520.585 | 511.680 |
As the meme goes, it ain't much - the new average runtime of 510.131 seconds was only a 0.8% decrease - but it's honest work. I wasn't expecting much since dict insertion is such a small part of the critical path, hopefully the other changes I had in mind were more impactful.
Removing TrieNode Boilerplate
At this point I actually turned my attention to py-fast-trie and realized trying to be as Pythonic as possible was hurting more than helping - I made the variables in TrieNode "private" with an underscore, but they still needed to be manipulated from outside so every interaction with data in a TrieNode was mediated by some Java-esque property function:
def _get_left(self) -> TrieNode | None:
    return self._left

[...]

def _set_left(self, new_left: TrieNode | None) -> None:
    self._left = new_left

[...]

left = property(_get_left, _set_left)
I looked over my shoulder to make sure Guido couldn't watch me sin before I made my variables "public" and deleted the property functions; I also deleted some vanity properties that were differently-named wrappers around existing data. Let nobody tell you crime doesn't pay, my Python crimes netted me a tidy speedup:
| Primes Inserted | Run 1 | Run 2 | Run 3 | Run 4 | Run 5 |
|---|---|---|---|---|---|
| 100,000 | 45.102 | 44.205 | 60.581 | 43.652 | 43.334 |
| 200,000 | 91.503 | 92.636 | 106.579 | 88.792 | 88.165 |
| 300,000 | 137.844 | 139.566 | 173.454 | 134.950 | 133.790 |
| 400,000 | 181.679 | 201.431 | 218.022 | 178.840 | 177.351 |
| 500,000 | 227.057 | 249.523 | 277.933 | 223.998 | 222.159 |
| 600,000 | 273.066 | 307.030 | 330.565 | 269.907 | 268.277 |
| 700,000 | 317.079 | 359.461 | 383.385 | 313.717 | 311.832 |
| 800,000 | 359.415 | 406.239 | 437.969 | 356.072 | 353.734 |
| 900,000 | 412.286 | 475.429 | 491.165 | 408.735 | 405.686 |
| 1,000,000 | 455.490 | 520.598 | 534.803 | 451.822 | 448.320 |
My benchmark now ran in an average runtime of 475.970 seconds, a 6.7% decrease in runtime from inlining __setitem__() helper functions alone and a 7.4% decrease in runtime from baseline.
insert() Helper Function Inlining
Since my benchmark is focused on insertion, I figured I'd get the biggest return on investment by looking at insert() for the X-fast trie - and I found some more low-hanging fruit at the start of the function. As each leaf should have a reference to its predecessor and successor leaves, insert(), reasonably, calls predecessor() and successor() to find them:
leaf_pred = self.predecessor(value) if self._count > 0 else None
leaf_succ = self.successor(value) if self._count > 0 else None
However, both those functions just call _get_closest_leaf() and go one step in opposite directions - and insert() needs to go both directions anyway. Instead of making two function calls that both end up calling the same function anyway, I make the function call directly and get everything I need at once:
if self._count > 0:
    neighbor = self._get_closest_leaf(value)

    # The closest leaf is the predecessor of the value to be inserted
    if neighbor.value < value:
        leaf_pred = neighbor
        leaf_succ = neighbor.right

    # The closest leaf is the successor of the value to be inserted
    elif neighbor.value > value:
        leaf_succ = neighbor
        leaf_pred = neighbor.left
This resulted in the first big impact of the session:
| Primes Inserted | Run 1 | Run 2 | Run 3 | Run 4 | Run 5 |
|---|---|---|---|---|---|
| 100,000 | 41.438 | 40.603 | 42.979 | 40.999 | 41.095 |
| 200,000 | 83.384 | 82.959 | 87.351 | 83.508 | 83.609 |
| 300,000 | 126.383 | 126.254 | 132.544 | 127.026 | 128.558 |
| 400,000 | 166.991 | 167.410 | 175.553 | 168.095 | 169.933 |
| 500,000 | 208.945 | 209.747 | 219.917 | 210.548 | 212.704 |
| 600,000 | 251.425 | 252.864 | 264.987 | 253.651 | 256.026 |
| 700,000 | 292.232 | 293.916 | 307.957 | 294.753 | 297.441 |
| 800,000 | 331.534 | 333.513 | 349.676 | 334.203 | 337.186 |
| 900,000 | 380.940 | 383.076 | 401.422 | 384.024 | 387.338 |
| 1,000,000 | 420.943 | 423.314 | 443.358 | 424.239 | 427.765 |
With an average runtime of 425.106 seconds this last change resulted in a 10.7% decrease in runtime from removing TrieNode boilerplate and a 17.3% decrease in runtime from baseline.
Removing Redundant Input Sanitization
To make sure the library never attempted to operate on invalid input, all the functions where a user would theoretically interact with the library called a sanitization function on input:
def __iadd__(self, value: int | bytes) -> XFastTrie:
    value = self._to_int(value, self._maxlen)
    self.insert(value)
    return self
However, because users could theoretically call insert() directly it also called the sanitization function:
def insert(self, value: int | bytes) -> None:
    value = self._to_int(value, self._maxlen)
    [...]
It didn't make sense to call that function twice so I removed the redundant calls to _to_int() for all the helper functions for a slight speedup:
| Primes Inserted | Run 1 | Run 2 | Run 3 | Run 4 | Run 5 |
|---|---|---|---|---|---|
| 100,000 | 40.213 | 41.987 | 40.749 | 40.266 | 40.611 |
| 200,000 | 81.800 | 85.372 | 83.088 | 81.974 | 84.468 |
| 300,000 | 124.271 | 129.844 | 126.365 | 124.635 | 127.621 |
| 400,000 | 164.377 | 171.911 | 167.344 | 165.100 | 168.547 |
| 500,000 | 205.895 | 215.486 | 209.621 | 206.893 | 210.853 |
| 600,000 | 248.038 | 259.710 | 252.534 | 249.308 | 253.889 |
| 700,000 | 288.276 | 302.006 | 293.618 | 289.834 | 294.889 |
| 800,000 | 326.877 | 342.684 | 333.332 | 328.799 | 334.416 |
| 900,000 | 375.741 | 393.699 | 383.036 | 377.808 | 383.985 |
| 1,000,000 | 415.021 | 435.202 | 423.252 | 417.456 | 424.107 |
This change dropped the average runtime to 421.605 seconds, a 0.8% runtime decrease from inlining predecessor/successor leaf discovery and an 18.0% decrease in runtime from baseline - once again yielding a small win for little work.
get_closest_leaf() Value Conversion
I began this optimization session with two primary strategies I gained from the last go-around: inline as many function calls as is reasonable; and eliminate as much bitbanging as possible. Thankfully there wasn't much bitbanging in py-fast-trie to begin with, but there was some in _get_closest_leaf():
direction = value >> (self._maxlen - level - 2) & 1
descendant = ancestor.left if direction == 0 else ancestor.right
Since _get_closest_leaf() was in the critical path for insertion I converted the integer manipulation into string manipulation:
leg = bin(value)[2:].zfill(self._maxlen)[level + 1]
descendant = ancestor.left if leg == "0" else ancestor.right
Given what this strategy did for _get_displaced_neighbors(), I expected a tidy performance boost:
| Primes Inserted | Run 1 | Run 2 | Run 3 | Run 4 | Run 5 |
|---|---|---|---|---|---|
| 100,000 | 42.789 | 40.969 | 43.094 | 40.826 | 42.622 |
| 200,000 | 86.834 | 83.419 | 87.190 | 83.228 | 87.070 |
| 300,000 | 131.933 | 126.828 | 132.348 | 126.575 | 132.157 |
| 400,000 | 174.629 | 168.065 | 174.953 | 167.681 | 175.010 |
| 500,000 | 218.733 | 210.559 | 218.979 | 210.098 | 219.153 |
| 600,000 | 263.500 | 253.780 | 263.586 | 253.346 | 263.841 |
| 700,000 | 306.331 | 295.005 | 306.311 | 294.614 | 306.430 |
| 800,000 | 347.549 | 334.739 | 347.465 | 334.353 | 347.597 |
| 900,000 | 399.028 | 384.396 | 398.805 | 384.203 | 398.941 |
| 1,000,000 | 440.930 | 424.744 | 440.521 | 424.613 | 440.773 |
I was rewarded with another quick win of an average runtime...increase...to 435.346 seconds, a 3.3% increase over removing redundant input sanitization but still a 15.3% reduction in runtime from baseline. To be honest these results threw me for a loop and I didn't notice how well this "optimization" performed until I was analyzing the data for this post - the final runtimes were "close enough" to the one before it that I assumed it was another small win; had I noticed at the time I would have undone it, but since the change is in all my subsequent runs I kept it in.
Rewriting insert()
At this point I felt good about decreasing average runtimes by 80 seconds, but I was still a ways from my goal of a sub-300 second average. To make matters worse, since py-fast-trie had less code than py-hopscotch-dict the low-hanging fruit was pretty much gone by now - if I wanted any more gains I was going to have to start working for them. Thankfully I knew there was still one big bundle of suck waiting for me: the trie insertion function. [3]
I'd skimmed the function when I removed predecessor() and successor() calls earlier, but as I read it more thoroughly I realized there was no way to escape a complete rewrite. I didn't want to do it since I knew finding all the little bugs a rewrite would introduce would take longer than rewriting it to begin with; but then I remembered initially writing the function, and I remembered making it add intermediate nodes up from the leaf instead of down from the closest existing ancestor, and I knew what I had to do.
A day or so later Hypothesis said my new version of insert() was good enough, so I declared another small victory against computers. And what did I get for my efforts - was the agita over remembering how to handle descendant pointers worth it?
| Primes Inserted | Run 1 | Run 2 | Run 3 | Run 4 | Run 5 |
|---|---|---|---|---|---|
| 100,000 | 13.566 | 13.627 | 13.262 | 13.471 | 13.357 |
| 200,000 | 28.504 | 28.604 | 27.886 | 28.350 | 28.122 |
| 300,000 | 44.400 | 44.555 | 43.463 | 44.245 | 43.834 |
| 400,000 | 57.867 | 58.030 | 56.645 | 57.592 | 57.146 |
| 500,000 | 72.680 | 72.886 | 71.150 | 72.337 | 71.875 |
| 600,000 | 88.150 | 88.418 | 86.297 | 87.750 | 87.187 |
| 700,000 | 101.703 | 101.931 | 99.536 | 101.066 | 100.587 |
| 800,000 | 113.377 | 113.543 | 110.883 | 112.524 | 112.083 |
| 900,000 | 135.700 | 136.013 | 132.814 | 135.194 | 134.157 |
| 1,000,000 | 148.050 | 148.341 | 144.802 | 147.401 | 146.304 |
Yeah, I'd say so. Every run was almost twice as fast at every point as when I stopped trying to optimize last time - on slower hardware! Runtimes decreased to an average of 147.251 seconds, a 66.2% decrease over my bitbanging replacement and a 71.4% decrease from baseline. I said this the last time I was optimizing and I'll say it again here: it felt great to make numbers like this, but it meant I wrote some real dogshit code in the past - at least I'm atoning for my computer crimes now.
Adding __slots__
After the last set of results I felt like I could declare overall victory, but despite all this work to make everything run faster I was still using too damn much memory:
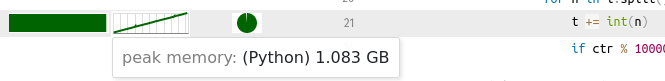
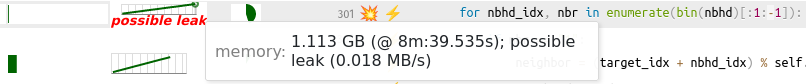
To be honest, I had no idea where it was going - 1 million 64-bit numbers should only take up 8MB of space so even with 20x overhead the trie should use far less than 1GB, plus prior attempts to use Scalene's memory leak detection feature resulted in alerts that put the false in false positive.
I don't remember why the idea came back to me, but I had a thought: "__slots__ is supposed to help with memory and you used it in py-hopscotch-dict without issue, why not try it in py-fast-trie too?"
class TrieNode:
    __slots__ = (
        "leaf",
        "left",
        "parent",
        "right",
        "value",
    )
[...]
class XFastTrie:
    __slots__ = (
        "_count",
        "_level_tables",
        "_max",
        "_maxlen",
        "_min",
        "_root",
    )
I didn't have any better ideas and it was quick to implement, so I added __slots__ on all the classes in py-fast-trie to surprising results:
| Primes Inserted | Run 1 | Run 2 | Run 3 | Run 4 | Run 5 |
|---|---|---|---|---|---|
| 100,000 | 12.137 | 12.176 | 12.192 | 12.170 | 12.178 |
| 200,000 | 25.670 | 25.753 | 25.853 | 25.713 | 25.756 |
| 300,000 | 40.092 | 40.137 | 40.377 | 40.040 | 40.192 |
| 400,000 | 52.349 | 52.410 | 52.644 | 52.208 | 52.396 |
| 500,000 | 65.816 | 65.825 | 66.144 | 65.578 | 65.859 |
| 600,000 | 79.758 | 79.773 | 80.195 | 79.467 | 79.848 |
| 700,000 | 90.353 | 90.392 | 90.724 | 90.068 | 90.423 |
| 800,000 | 102.484 | 102.514 | 102.775 | 102.183 | 102.479 |
| 900,000 | 122.755 | 122.711 | 123.494 | 122.396 | 122.773 |
| 1,000,000 | 134.319 | 134.221 | 135.025 | 133.940 | 134.299 |
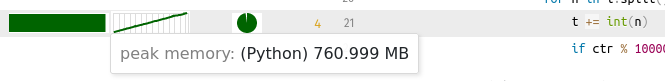
My new average runtime was 134.280 seconds, an 8.8% decrease from rewriting insert() and a 73.9% decrease from baseline; but more importantly I managed to reduce memory usage by over 300MB from baseline!
get_closest_leaf() Value Deconversion
Everybody makes mistakes, and I definitely made one when I thought getting rid of bitbanging would speed up _get_closest_leaf() - but to be fair that has been the truth basically every other time I've tried it. Anyway, reverting the change did what I expected:
| Primes Inserted | Run 1 | Run 2 | Run 3 | Run 4 | Run 5 |
|---|---|---|---|---|---|
| 100,000 | 12.153 | 12.111 | 12.317 | 12.109 | 12.073 |
| 200,000 | 25.714 | 25.662 | 26.068 | 25.574 | 25.584 |
| 300,000 | 40.102 | 40.022 | 40.645 | 39.871 | 39.918 |
| 400,000 | 52.322 | 52.177 | 52.993 | 52.034 | 52.098 |
| 500,000 | 65.732 | 65.545 | 66.562 | 65.379 | 65.468 |
| 600,000 | 79.652 | 79.449 | 80.672 | 79.203 | 79.334 |
| 700,000 | 90.270 | 89.917 | 91.403 | 89.734 | 89.858 |
| 800,000 | 102.362 | 101.868 | 103.609 | 101.786 | 101.852 |
| 900,000 | 122.628 | 122.275 | 124.173 | 121.907 | 121.997 |
| 1,000,000 | 134.152 | 133.727 | 135.824 | 133.348 | 133.410 |
Average runtimes decreased slightly to 133.763 seconds, 0.4% from adding __slots__ and 74.0% overall. I thought the speedup would be greater since moving away from bitbanging led to a 3.3% increase, but I assume rewriting insert() may have decreased the benefit of _get_closest_leaf() being faster.
__contains__() Helper Function Inlining
As I was rewriting insert(), it finally clicked the first line calls __contains__() in py-hopscotch-dict but that function is still essentially boilerplate:
def __contains__(self, key: Hashable) -> bool:
    _, idx = self._lookup(key)
    return idx is not None
I decided to return to py-hopscotch-dict and inline the _lookup() call into __contains__() like I'd done for most of the other dict access functions:
def __contains__(self, key: Hashable) -> bool:
    result = False
    home_idx = abs(hash(key)) % self._size

    nbhd = self._nbhds[home_idx]
    for nbhd_idx, nbr in enumerate(bin(nbhd)[:1:-1]):
        if nbr == "1":
            neighbor = (home_idx + nbhd_idx) % self._size
            data_idx = self._indices[neighbor]

            if data_idx < 0:
                raise RuntimeError(
                    (
                        "Index {} has supposed displaced neighbor that points to "
                        "free index"
                    ).format(home_idx)
                )

            if self._keys[data_idx] == key:
                result = True
                break

    return result
The benefit was less than expected, but still welcome:
| Primes Inserted | Run 1 | Run 2 | Run 3 | Run 4 | Run 5 |
|---|---|---|---|---|---|
| 100,000 | 11.852 | 11.913 | 11.697 | 11.960 | 11.787 |
| 200,000 | 25.203 | 25.313 | 24.785 | 25.326 | 25.017 |
| 300,000 | 39.435 | 39.555 | 38.695 | 39.544 | 39.077 |
| 400,000 | 51.381 | 51.550 | 50.450 | 51.553 | 50.905 |
| 500,000 | 64.576 | 64.808 | 63.352 | 64.776 | 63.963 |
| 600,000 | 78.305 | 78.566 | 76.742 | 78.481 | 77.540 |
| 700,000 | 88.572 | 88.879 | 86.838 | 88.837 | 87.703 |
| 800,000 | 100.363 | 100.694 | 98.437 | 100.669 | 99.373 |
| 900,000 | 120.675 | 121.089 | 118.113 | 120.821 | 119.443 |
| 1,000,000 | 131.940 | 132.335 | 129.160 | 132.158 | 130.580 |
Runtimes now averaged 131.559 seconds, a 1.6% decrease over returning to bitbanging in _get_closest_leaf() and a 74.4% decrease in runtime overall.
__resize__() Refactoring
The Scalene reports suggested I was still spending a surprising amount of time in __resize__(), so I decided to see what performance improvements were possible there.
for data_idx, key in enumerate(self._keys):
    expected_lookup_idx = abs(hash(key)) % new_size

    open_nbr_idx = self._get_open_neighbor(expected_lookup_idx)
    if open_nbr_idx is None:
        if new_size - expected_lookup_idx < self._nbhd_size:
            free_up_idx = 0
        else:
            free_up_idx = expected_lookup_idx

        self._free_up(free_up_idx)
        open_nbr_idx = cast(int, self._get_open_neighbor(expected_lookup_idx))
    nbhd_idx = (open_nbr_idx - expected_lookup_idx) % new_size
    self._set_neighbor(expected_lookup_idx, nbhd_idx)
    self._set_lookup_index_info(open_nbr_idx, data=data_idx)
I couldn't help thinking eating two calls to _get_open_neighbor() every time a neighborhood was too full was a bit ridiculous, so I inlined the functionality as best I could:
for data_idx, key in enumerate(self._keys):
    found_nbr = False
    home_idx = abs(hash(key)) % new_size

    for offset in range(self._nbhd_size):
        nbr = (home_idx + offset) % self._size
        if self._indices[nbr] == self.FREE_ENTRY:
            self._set_neighbor(home_idx, offset)
            self._set_lookup_index_info(nbr, data=data_idx)
            found_nbr = True
            break

    if not found_nbr:
        free_up_idx = 0 if new_size - home_idx < self._nbhd_size else home_idx
        self._free_up(free_up_idx)

        for offset in range(self._nbhd_size):
            nbr = (home_idx + offset) % self._size
            if self._indices[nbr] == self.FREE_ENTRY:
                self._set_neighbor(home_idx, offset)
                self._set_lookup_index_info(nbr, data=data_idx)
                break
I still don't like writing essentially the same loop twice, but I can't argue with the results:
| Primes Inserted | Run 1 | Run 2 | Run 3 | Run 4 | Run 5 |
|---|---|---|---|---|---|
| 100,000 | 11.669 | 11.642 | 11.647 | 11.684 | 11.590 |
| 200,000 | 24.610 | 24.656 | 24.608 | 24.687 | 24.453 |
| 300,000 | 38.380 | 38.435 | 38.350 | 38.436 | 38.045 |
| 400,000 | 50.085 | 50.158 | 50.023 | 50.206 | 49.678 |
| 500,000 | 62.948 | 62.992 | 62.840 | 63.056 | 62.399 |
| 600,000 | 76.343 | 76.312 | 76.166 | 76.403 | 75.635 |
| 700,000 | 86.521 | 86.421 | 86.273 | 86.624 | 85.765 |
| 800,000 | 98.242 | 98.058 | 97.906 | 98.357 | 97.328 |
| 900,000 | 117.489 | 117.430 | 117.345 | 117.531 | 116.343 |
| 1,000,000 | 128.543 | 128.437 | 128.356 | 128.608 | 127.282 |
I now had an average runtime of 128.445 seconds, a 2.4% decrease from inlining helper functions in __contains__() and a 75.0% decrease from baseline.
Neighborhood Management Inlining
While I was refactoring _resize() I took a look at some of the other helper functions to remind myself how much "help" they actually provide:
def _set_neighbor(self, lookup_idx: int, nbhd_idx: int) -> None:
    if lookup_idx < 0 or nbhd_idx < 0:
        raise ValueError("Indexes cannot be negative")
    elif lookup_idx >= self._size:
        raise ValueError(f"Index {lookup_idx} outside array")
    elif nbhd_idx >= self._nbhd_size:
        raise ValueError("Trying to set neighbor outside neighborhood")

    self._nbhds[lookup_idx] |= 1 << nbhd_idx

def _clear_neighbor(self, lookup_idx: int, nbhd_idx: int) -> None:
    if lookup_idx < 0 or nbhd_idx < 0:
        raise ValueError("Indexes cannot be negative")
    elif lookup_idx >= self._size:
        raise ValueError(f"Index {lookup_idx} outside array")
    elif nbhd_idx >= self._nbhd_size:
        raise ValueError("Trying to clear neighbor outside neighborhood")

    self._nbhds[lookup_idx] &= ~(1 << nbhd_idx)
I know I originally wrote my code like this to "be more professional" and "avoid DRY", but eating a function call in a hot loop for one line of bitbanging is ridiculous and I would stand for it no longer. Even though I'm still not a fan of bitbanging I couldn't think of a better way that was still idempotent so I inlined the code as it was:
for data_idx, key in enumerate(self._keys):
    found_nbr = False
    home_idx = abs(hash(key)) % new_size

    for offset in range(self._nbhd_size):
        nbr = (home_idx + offset) % self._size
        if self._indices[nbr] == self.FREE_ENTRY:
            # Mark the neighbor storing the entry index as occupied
            self._nbhds[home_idx] |= 1 << offset
            self._set_lookup_index_info(nbr, data=data_idx)
            found_nbr = True
            break

    if not found_nbr:
        free_up_idx = 0 if new_size - home_idx < self._nbhd_size else home_idx
        self._free_up(free_up_idx)

        for offset in range(self._nbhd_size):
            nbr = (home_idx + offset) % self._size
            if self._indices[nbr] == self.FREE_ENTRY:
                # Mark the neighbor storing the entry index as occupied
                self._nbhds[home_idx] |= 1 << offset
                self._set_lookup_index_info(nbr, data=data_idx)
                break
At least one of my heuristics didn't let me down:
| Primes Inserted | Run 1 | Run 2 | Run 3 | Run 4 | Run 5 |
|---|---|---|---|---|---|
| 100,000 | 11.453 | 11.186 | 11.307 | 11.374 | 11.319 |
| 200,000 | 24.095 | 23.575 | 23.766 | 23.958 | 23.845 |
| 300,000 | 37.361 | 36.680 | 36.867 | 37.208 | 37.058 |
| 400,000 | 48.807 | 47.977 | 48.172 | 48.634 | 48.374 |
| 500,000 | 61.321 | 60.249 | 60.461 | 61.084 | 60.719 |
| 600,000 | 74.274 | 72.991 | 73.233 | 73.960 | 73.580 |
| 700,000 | 84.264 | 82.817 | 83.156 | 83.960 | 83.455 |
| 800,000 | 95.777 | 94.081 | 94.592 | 95.492 | 94.824 |
| 900,000 | 114.183 | 112.017 | 112.552 | 113.673 | 113.149 |
| 1,000,000 | 124.927 | 122.507 | 123.203 | 124.409 | 123.798 |
The average runtime decreased to 123.803 seconds, a 3.6% runtime decrease from refactoring _resize() and a 75.9% decrease from baseline.
Index Information Inlining
The keen-eyed reader may have noticed a second helper function in the snippet of _resize():
def _set_lookup_index_info(
    self, lookup_idx: int, data: Optional[int] = None, nbhd: Optional[int] = None
) -> None:
    if lookup_idx < 0:
        raise ValueError("Indexes cannot be negative")
    elif lookup_idx >= self._size:
        raise ValueError(f"Index {lookup_idx} outside array")

    if data is not None:
        self._indices[lookup_idx] = data

    if nbhd is not None:
        self._nbhds[lookup_idx] = nbhd
As it turned out I built a "two-line" helper function, but I only used one of the legs so it ended up being a one-line helper function as well. Obviously I got rid of it:
for data_idx, key in enumerate(self._keys):
    found_nbr = False
    home_idx = abs(hash(key)) % new_size

    for offset in range(self._nbhd_size):
        nbr = (home_idx + offset) % self._size
        if self._indices[nbr] == self.FREE_ENTRY:
            # Mark the neighbor storing the entry index as occupied
            self._nbhds[home_idx] |= 1 << offset
            self._indices[nbr] = data_idx
            found_nbr = True
            break

    if not found_nbr:
        free_up_idx = 0 if new_size - home_idx < self._nbhd_size else home_idx
        self._free_up(free_up_idx)

        for offset in range(self._nbhd_size):
            nbr = (home_idx + offset) % self._size
            if self._indices[nbr] == self.FREE_ENTRY:
                # Mark the neighbor storing the entry index as occupied
                self._nbhds[home_idx] |= 1 << offset
                self._indices[nbr] = data_idx
                break
The benefit here was also obvious:
| Primes Inserted | Run 1 | Run 2 | Run 3 | Run 4 | Run 5 |
|---|---|---|---|---|---|
| 100,000 | 10.723 | 11.064 | 10.861 | 10.850 | 11.022 |
| 200,000 | 22.405 | 23.174 | 22.694 | 22.719 | 23.078 |
| 300,000 | 34.683 | 35.831 | 35.096 | 35.128 | 35.725 |
| 400,000 | 45.415 | 46.918 | 45.917 | 45.973 | 46.790 |
| 500,000 | 56.952 | 58.872 | 57.622 | 57.696 | 58.728 |
| 600,000 | 68.932 | 71.273 | 69.730 | 69.862 | 71.103 |
| 700,000 | 78.363 | 81.036 | 79.275 | 79.456 | 80.858 |
| 800,000 | 89.294 | 92.324 | 90.341 | 90.546 | 92.087 |
| 900,000 | 105.790 | 109.434 | 106.981 | 107.250 | 109.142 |
| 1,000,000 | 115.745 | 119.785 | 117.074 | 117.404 | 119.458 |
At 117.979 seconds, the average benchmark runtime decreased 4.7% from inlining neighborhood management and 77.1% from baseline.
Wrapping Up
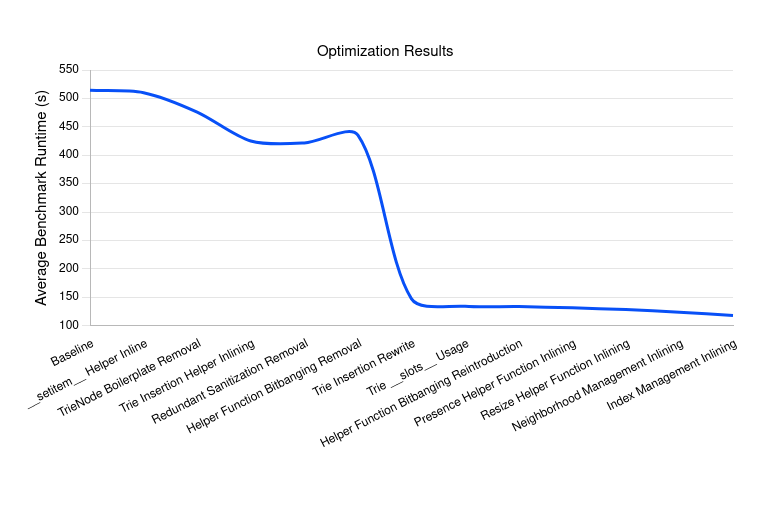
To be honest, I thought about stopping after I put bitbanging back in _get_closest_leaf() - I wanted to see a sub-120 second run, but had no idea how to shave off an additional 15 seconds - but I'm glad I stuck with it. Now my last goal is to insert the first 100k primes in under 10 seconds on this hardware - but I've put too much time into this already. I'm never happy realizing I write such unperformant garbage code but I am satisfied with the results I get when I sit down and try to improve it. I decided to play a data scientist and put all my data into a spreadsheet so I could do some math on it:
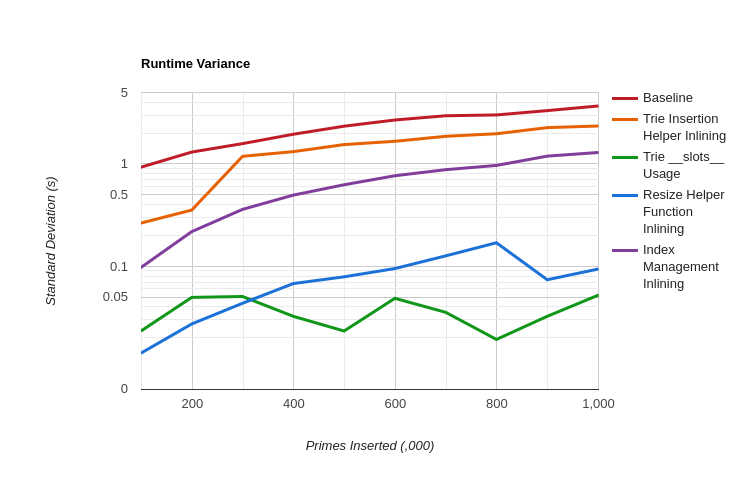
I'm glad I managed to ultimately reduce the standard deviation of my benchmark runs by roughly a factor of three, but I don't what I changed from when I cut it by a factor of 70.
Memory usage declined from 1109 MiB to 761 MiB, a 31% decrease pretty much entirely from using __slots__ on TrieNode. I didn't realize how many TrieNode objects I make in py-fast-trie; since there's so many of them a small savings goes a long way, but since there's basically nothing in them I don't have many options to make them smaller.
Just for funsies, I ran my benchmark script without Scalene on my homelab server with a Ryzen 5 5650 and DDR4-3200 memory:
| Primes Inserted | Runtime |
|---|---|
| 100,000 | 2.576 |
| 200,000 | 5.332 |
| 300,000 | 8.235 |
| 400,000 | 10.803 |
| 500,000 | 13.563 |
| 600,000 | 16.421 |
| 700,000 | 19.040 |
| 800,000 | 21.339 |
| 900,000 | 25.175 |
| 1,000,000 | 27.512 |

| [1] | Perhaps I've read too many SwiftOnSecurity tweets and it's starting to poison my brain, yeesh |
| [2] | The processor was built before they even put the generation in the model number! |
| [3] | "Thankfully"; the trie deletion function also sucked and I rewrote it at the same time, but it doesn't get called as part of my benchmark and was less sucky |